IAT 355 Final Project
Analyzing and Comparing Tottenham Hotspur's Seasonal Performance in the Premier League from 2006/2007 to 2017/2018 seasons.
Tottenham Hotspur and the Premier League
Tottenham Hotspur F.C., often referred to as “Tottenham” or “Spurs” by the football community, is one of the most prominent clubs in the Premier League. Despite being a part of the elite “Big 6” group—comprising Arsenal, Chelsea, Liverpool, Manchester United, Manchester City, and Tottenham Hotspur—which has historically dominated the league, Spurs have not won a major trophy in the last 20 years. This analysis will delve into Tottenham's seasonal performance in the Premier League from the 2006/2007 to 2017/2018 seasons, exploring trends and insights that may help explain why they've fallen short of silverware despite their stature. But before diving into the data, let's first understand what the Premier League is all about.
What is the Premier League?
The English Premier League (EPL), often referred to as simply the Premier League, is the pinnacle of professional football in England and represents the highest tier of the English football league system. It operates under a promotion and relegation system with the English Football League (EFL) and is contested by 20 clubs each season.
Running from August to May, the league's format sees each team play 38 matches—home and away against every other club. Teams earn:
- 3 points for a win,
- 1 point for a draw, and
- 0 points for a loss.
At the end of the season, the team with the most points is crowned the champion, while the bottom three clubs are relegated to the EFL Championship, replaced by the top three teams from the lower division.
Notable Teams and Historical Legacy
The Premier League is renowned for its intense competition and world-class clubs. Notable teams include Manchester United, Liverpool, Arsenal, Chelsea, Manchester City, and Tottenham Hotspur. Each has contributed to the league's rich history in unique ways:
- Manchester United: Boasts an unparalleled legacy with 13 Premier League titles under the legendary Sir Alex Ferguson.
- Manchester City: Has been a dominant force in recent years, clinching multiple titles under the tactical genius of Pep Guardiola.
- Liverpool and Arsenal: Known for their storied history and passionate fanbases.
- Chelsea: A powerhouse that has consistently challenged for domestic and international honors.
As it can be seen in the chart below the Big 6 teams have all won a considerable amoount of matches out of a total of 456 matches.
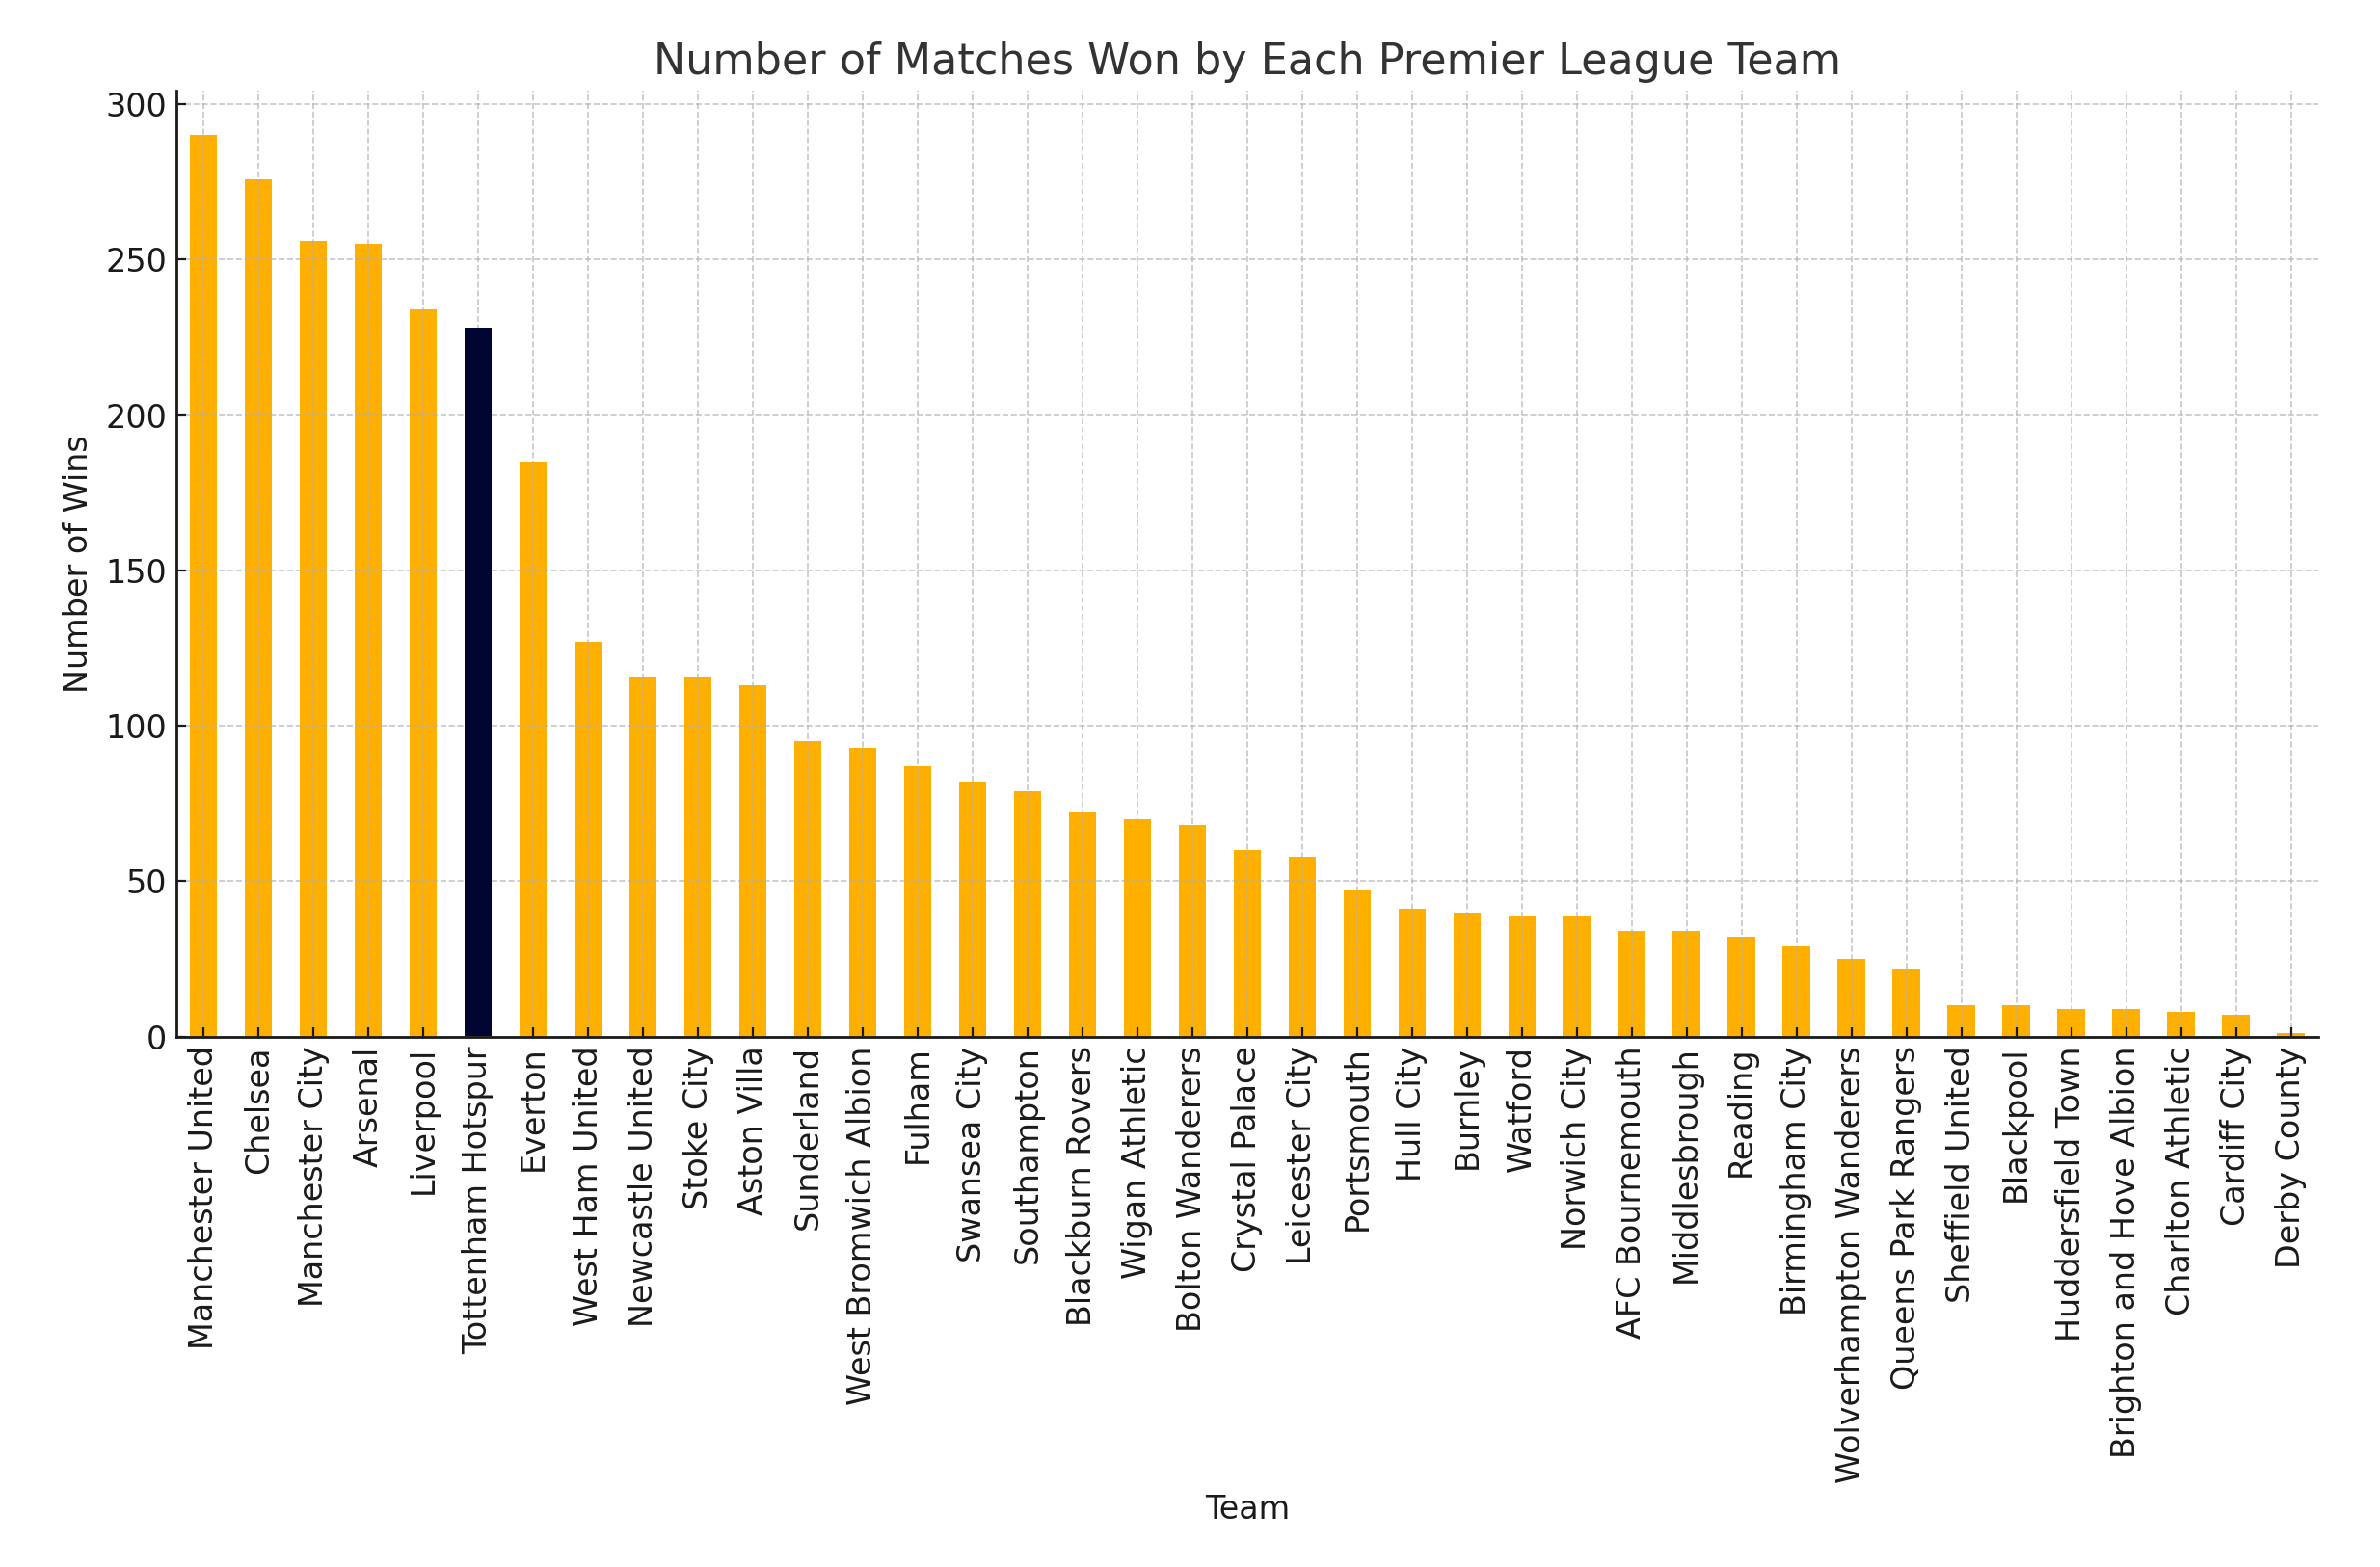
Now let's start analyzing Tottehnam's performance.
Goals Scored vs. Goals Conceded by Season (Tottenham Hotspur)
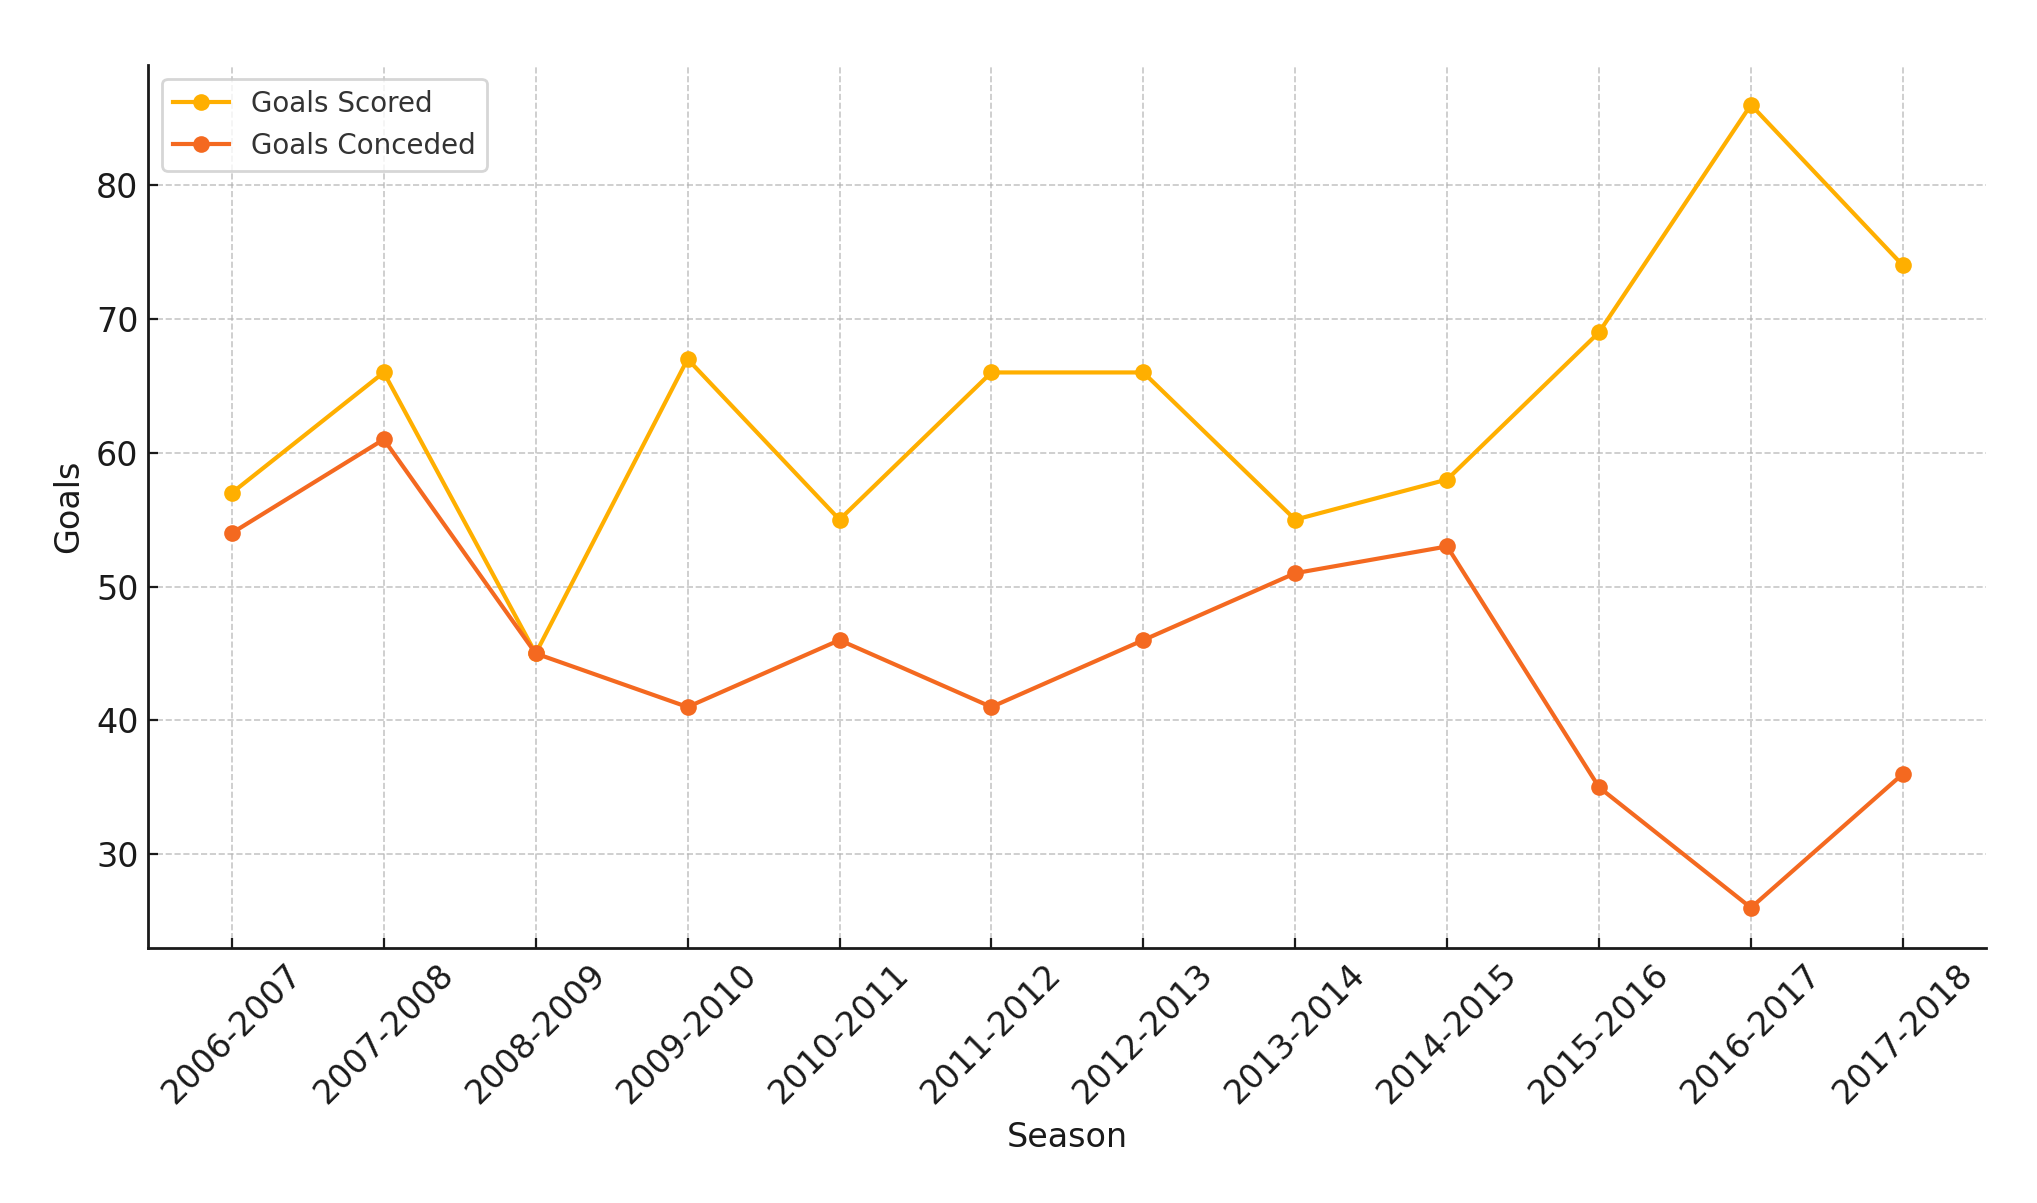
The line chart illustrates Tottenham Hotspur's goals scored and conceded across Premier League seasons from 2006-2007 to 2017-2018, revealing trends in their offensive and defensive performance.
Tottenham's goals scored exhibit a general upward trajectory, reflecting significant improvements in their attacking capabilities over the years. Notable peaks occur in the 2009-2010, 2011-2012, and especially the 2016-2017 season, where they recorded their highest scoring output. This trend highlights periods of strong offensive momentum, driven by tactical effectiveness and possibly key player contributions.
Conversely, the goals conceded trend is more inconsistent but shows marked improvement in later seasons. The 2016-2017 season stands out with the fewest goals conceded, indicating a well-organized defense. From 2014-2015 to 2016-2017, Tottenham demonstrated a growing balance between attack and defense, achieving their strongest performances during this phase.
The widening gap between goals scored and conceded in the later seasons signals Tottenham's evolution into a more dominant and competitive team. The chart underscores the 2016-2017 season as a high point in their performance, reflecting a peak in both offensive and defensive efficiency. These trends suggest the impact of strategic changes, such as managerial decisions and squad development, over the observed period.
Match Outcomes by Season
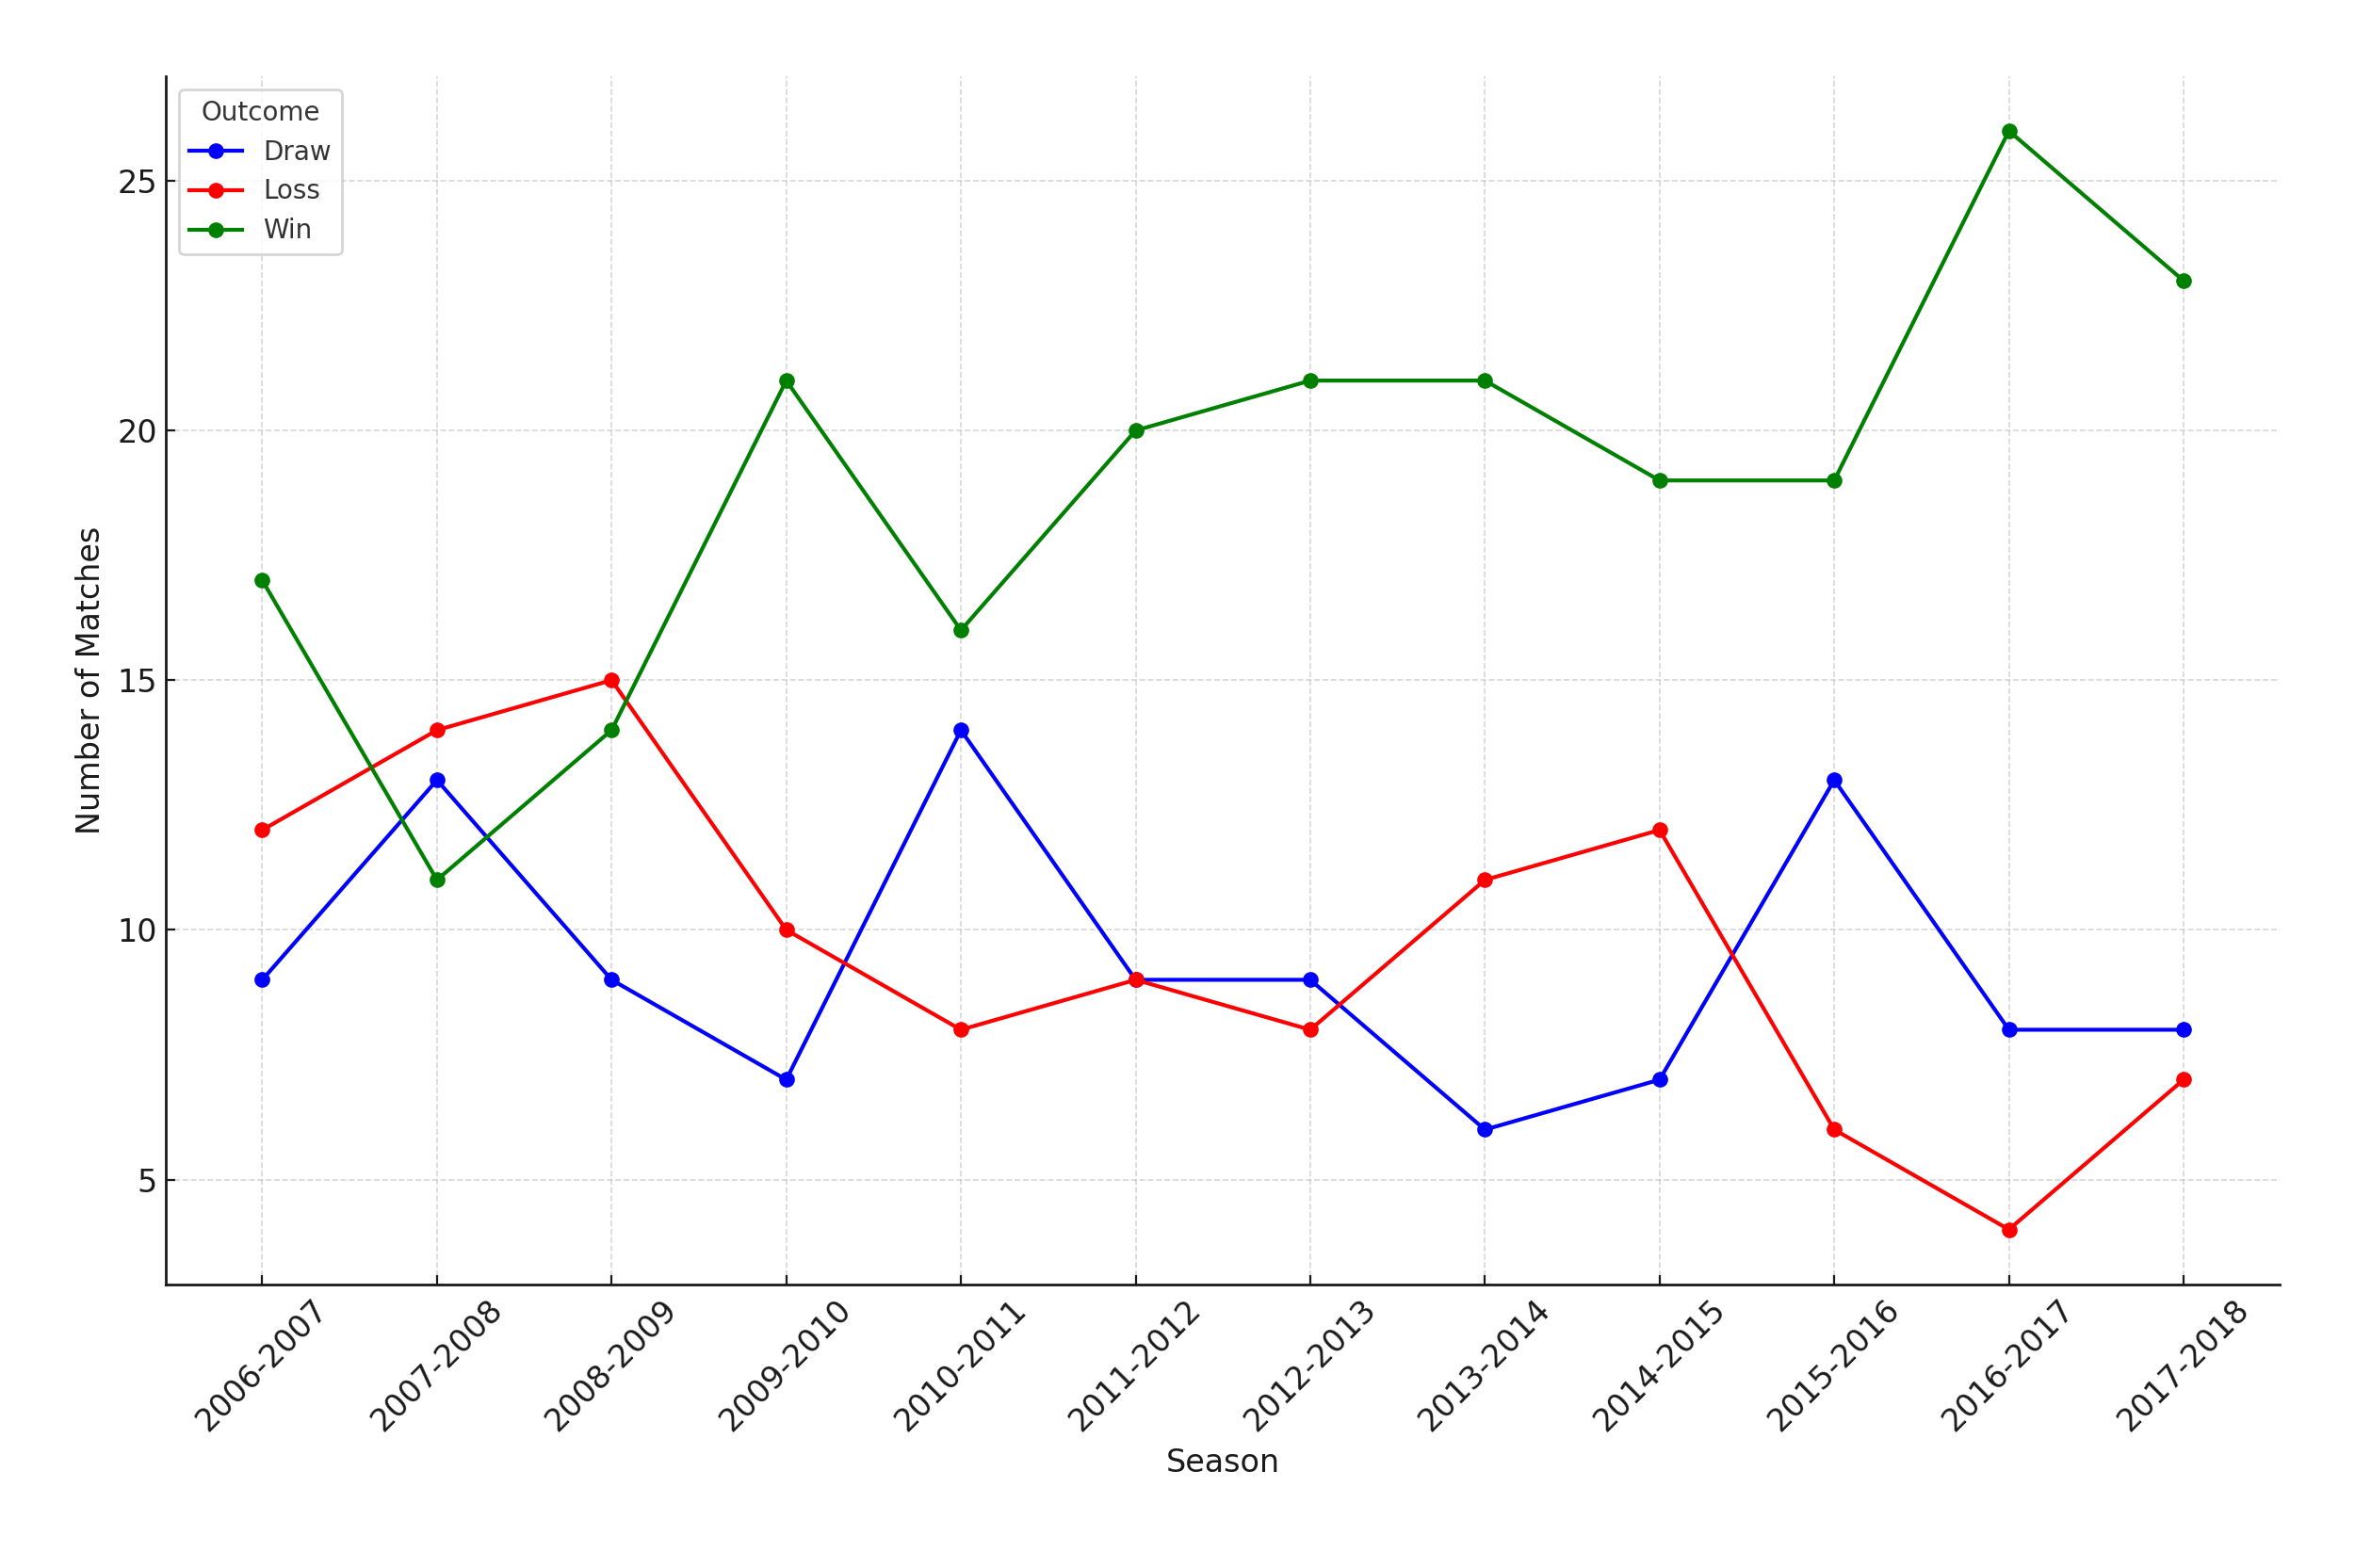
This highlights Tottenham's match outcomes across seasons, revealing patterns in their performance consistency. Peaks in wins are observed during the 2010-2011 and 2016-2017 seasons, aligning with their strongest attacking and defensive phases. The analysis also indicates phases of stagnation, as seen in seasons like 2008-2009, where draws dominated. Understanding these trends provides insights into the club's overall strategies and performance evolution.
Discipline Trends (Yellow and Red Cards)
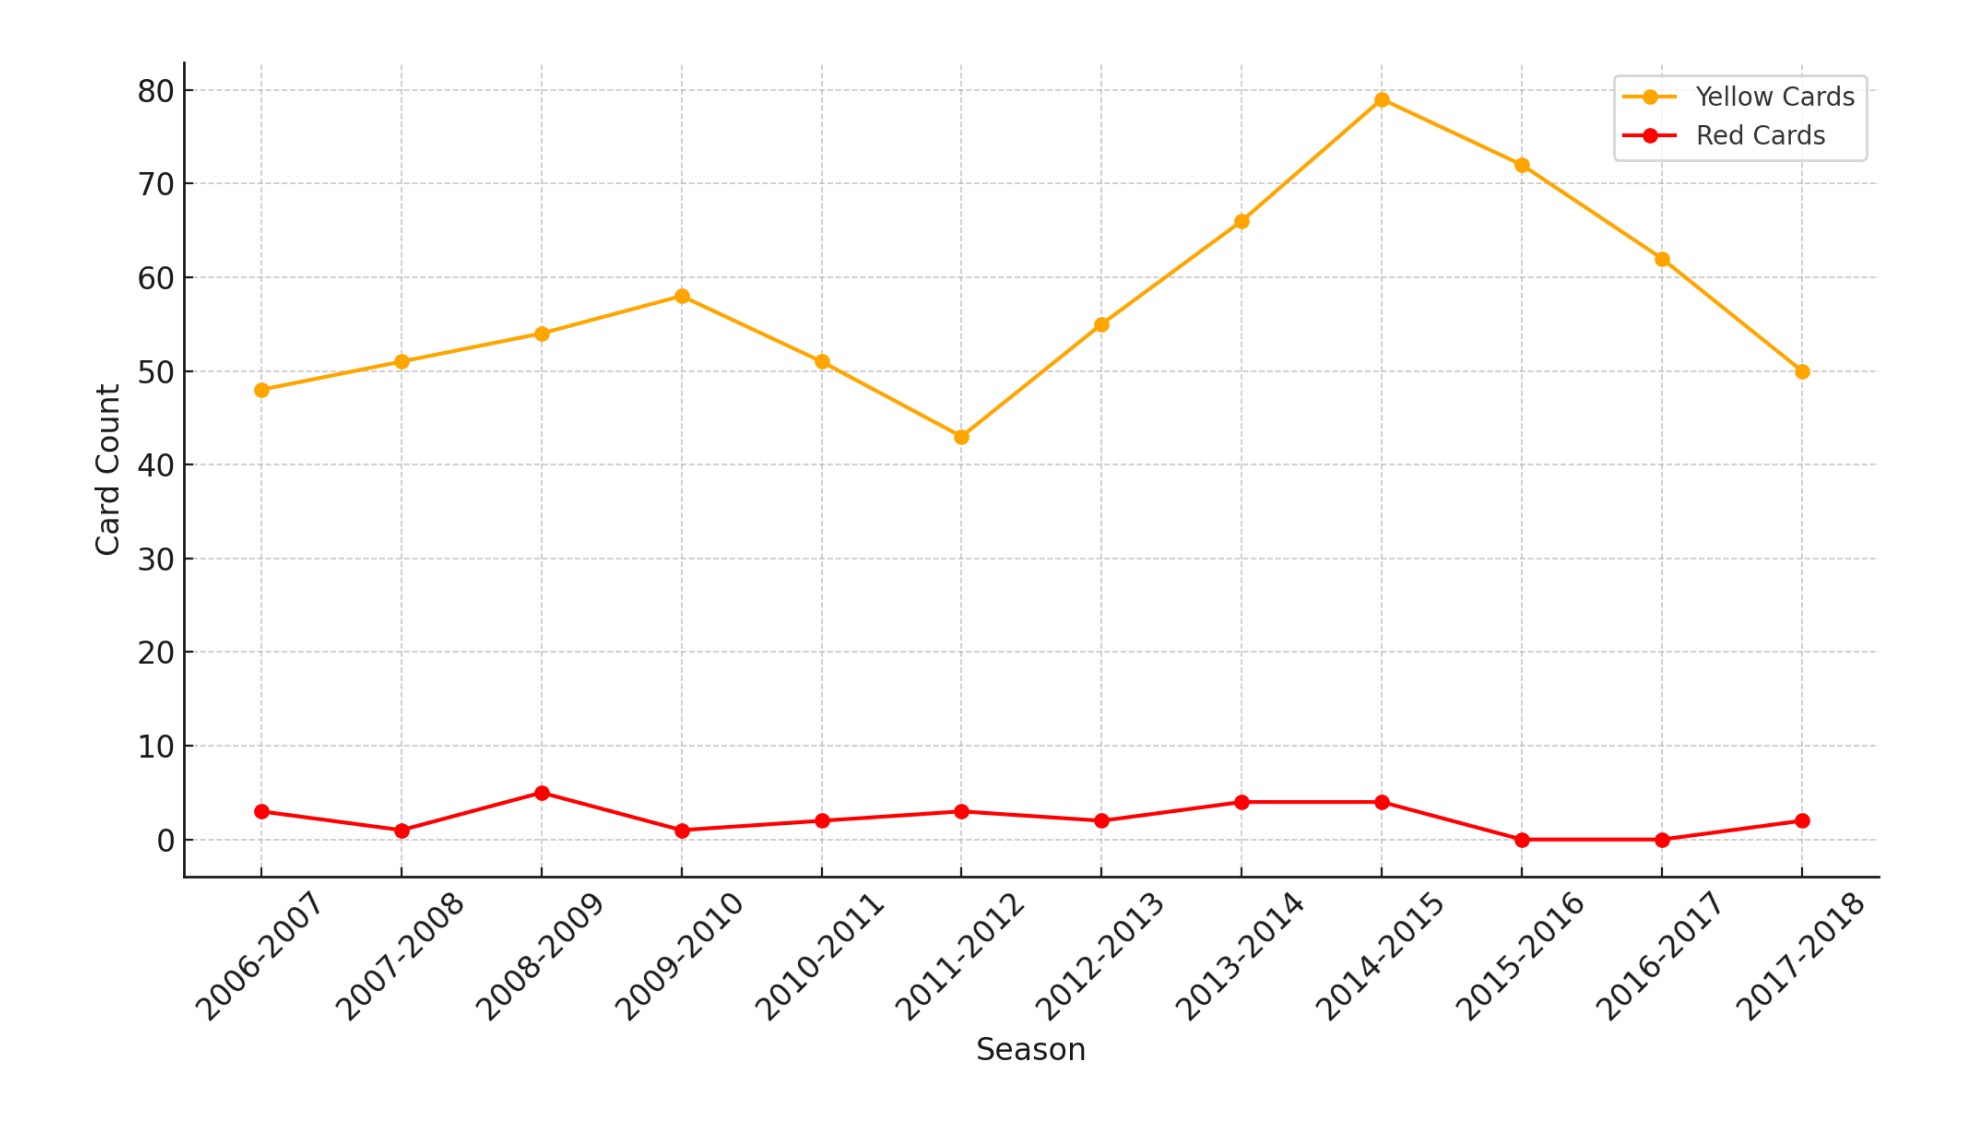
The trend for yellow cards (orange line) is generally upward, peaking in the 2014-2015 season with over 70 cards, indicating heightened disciplinary issues during this period. A decline follows in the subsequent seasons, with the lowest count occurring in 2017-2018, suggesting improved discipline or changes in tactical approach.
Red cards (red line) remain relatively low and consistent across the seasons, typically ranging between 0 and 5 per season. This reflects a strong adherence to avoiding major infractions despite fluctuations in yellow card trends. Minor spikes, such as in 2009-2010 and 2017-2018, are isolated and do not indicate a significant disciplinary problem.
The gap between yellow and red cards indicates that most infractions committed by Tottenham resulted in warnings rather than ejections, signifying controlled aggression in their playing style. However, the high volume of yellow cards in certain seasons, particularly 2014-2015, may have disrupted match momentum or risked escalating to red cards.
Shooting Efficiency (Total vs. On-Target Scoring Attempts)
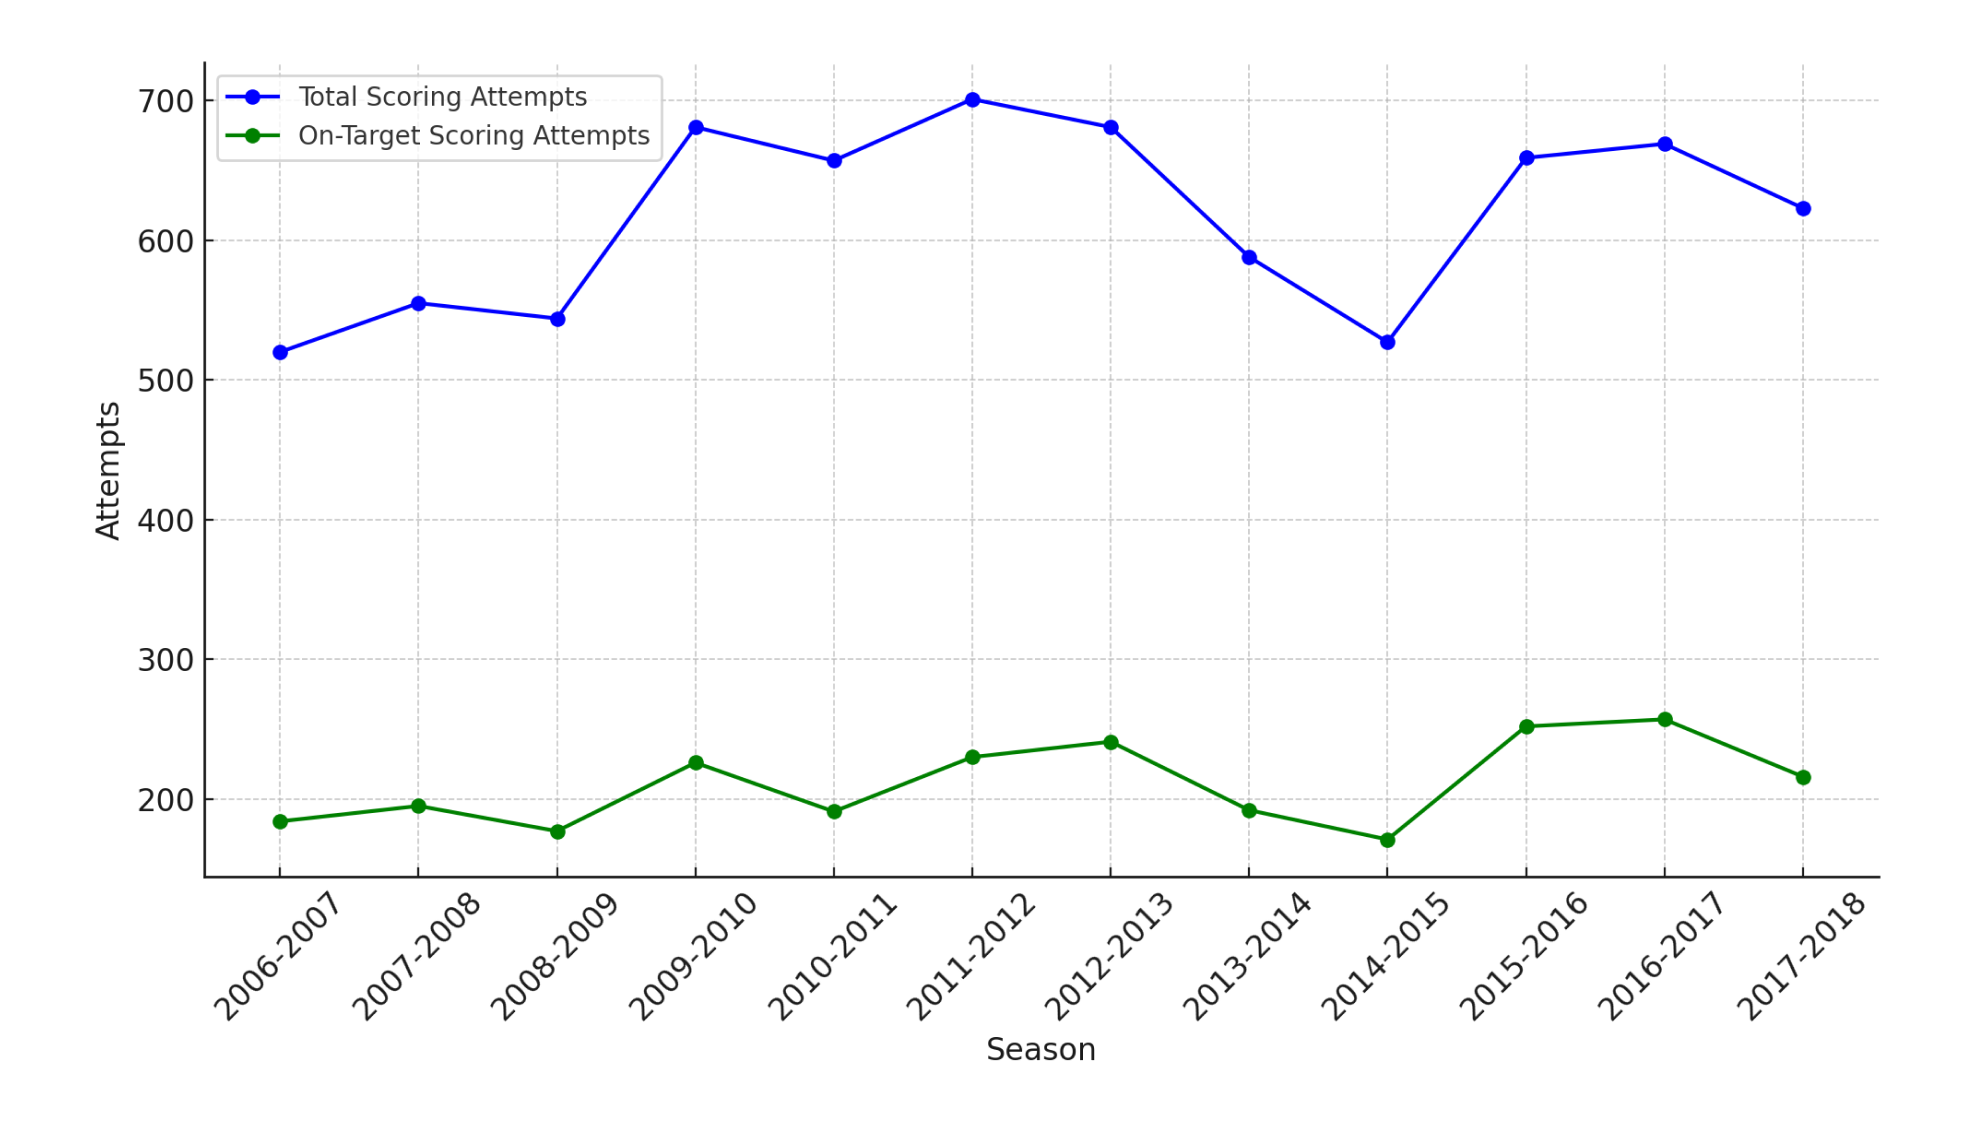
The total scoring attempts (blue line) show a steady upward trend from 2006-2007, peaking during the 2013-2014 and 2016-2017 seasons. This indicates that Tottenham's offensive strategies increasingly emphasized creating scoring opportunities. However, a noticeable dip occurs in the 2017-2018 season, suggesting a decline in total attempts compared to previous highs.
On-target attempts (green line) remain relatively stable across the seasons, with slight increases during the 2009-2010, 2012-2013, and 2016-2017 seasons. This suggests that while total attempts increased significantly over time, the proportion of shots on target did not rise at the same rate. The consistency in on-target attempts highlights the need for improved shooting accuracy to capitalize on the increased volume of scoring opportunities.
The gap between total attempts and on-target attempts widens in seasons with higher totals, such as 2013-2014 and 2016-2017. This reflects inefficiencies in converting attempts into meaningful opportunities, pointing to potential areas for improvement in finishing or shot selection.
Tottenham vs. League Average: Scoring Performance
Offensive Performance
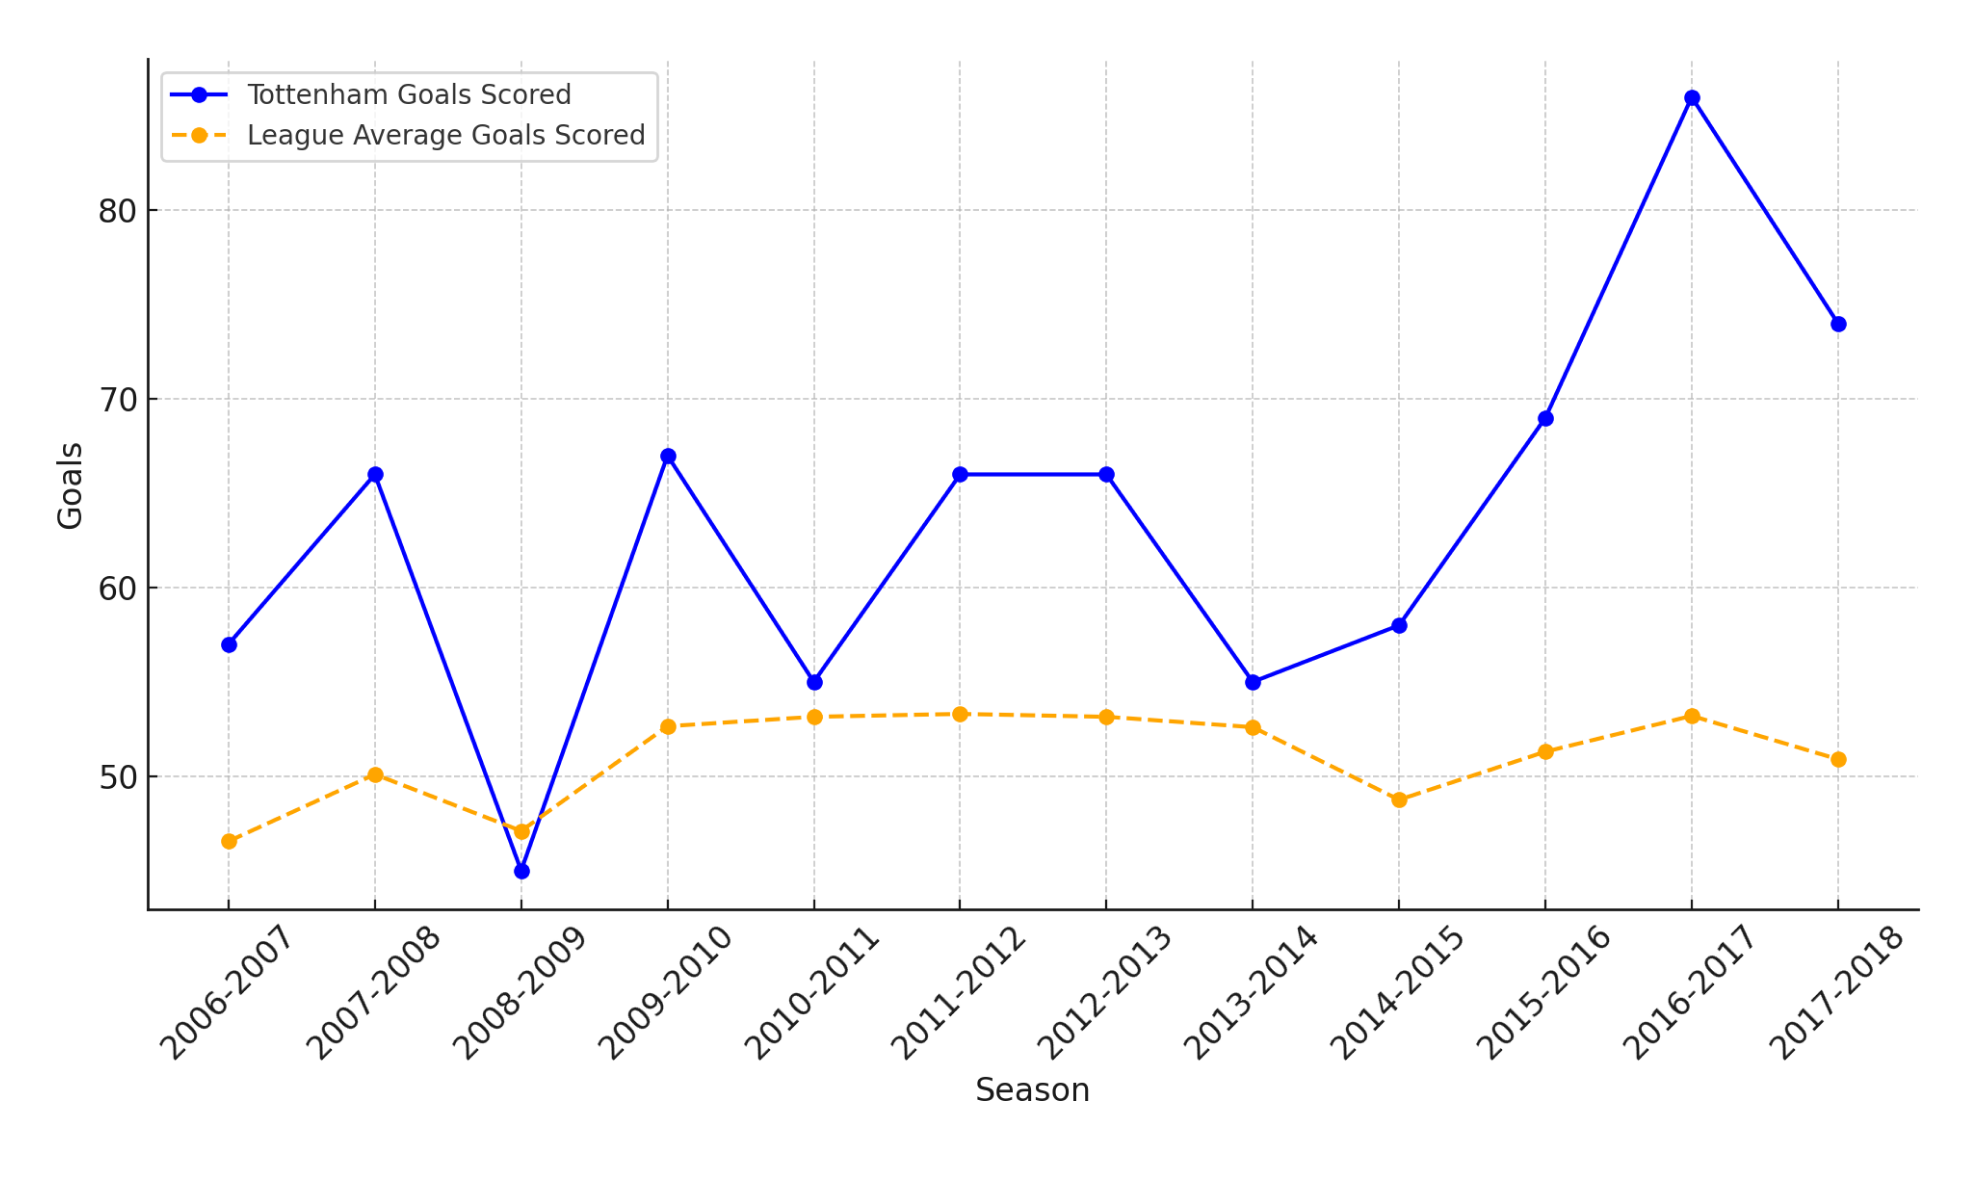
This chart compares Tottenham's scoring performance against the league average from 2006-2007 to 2017-2018. Notably, Tottenham consistently outperformed the league average in goals scored from 2010 onwards, reflecting their offensive growth.
Defensive Performance
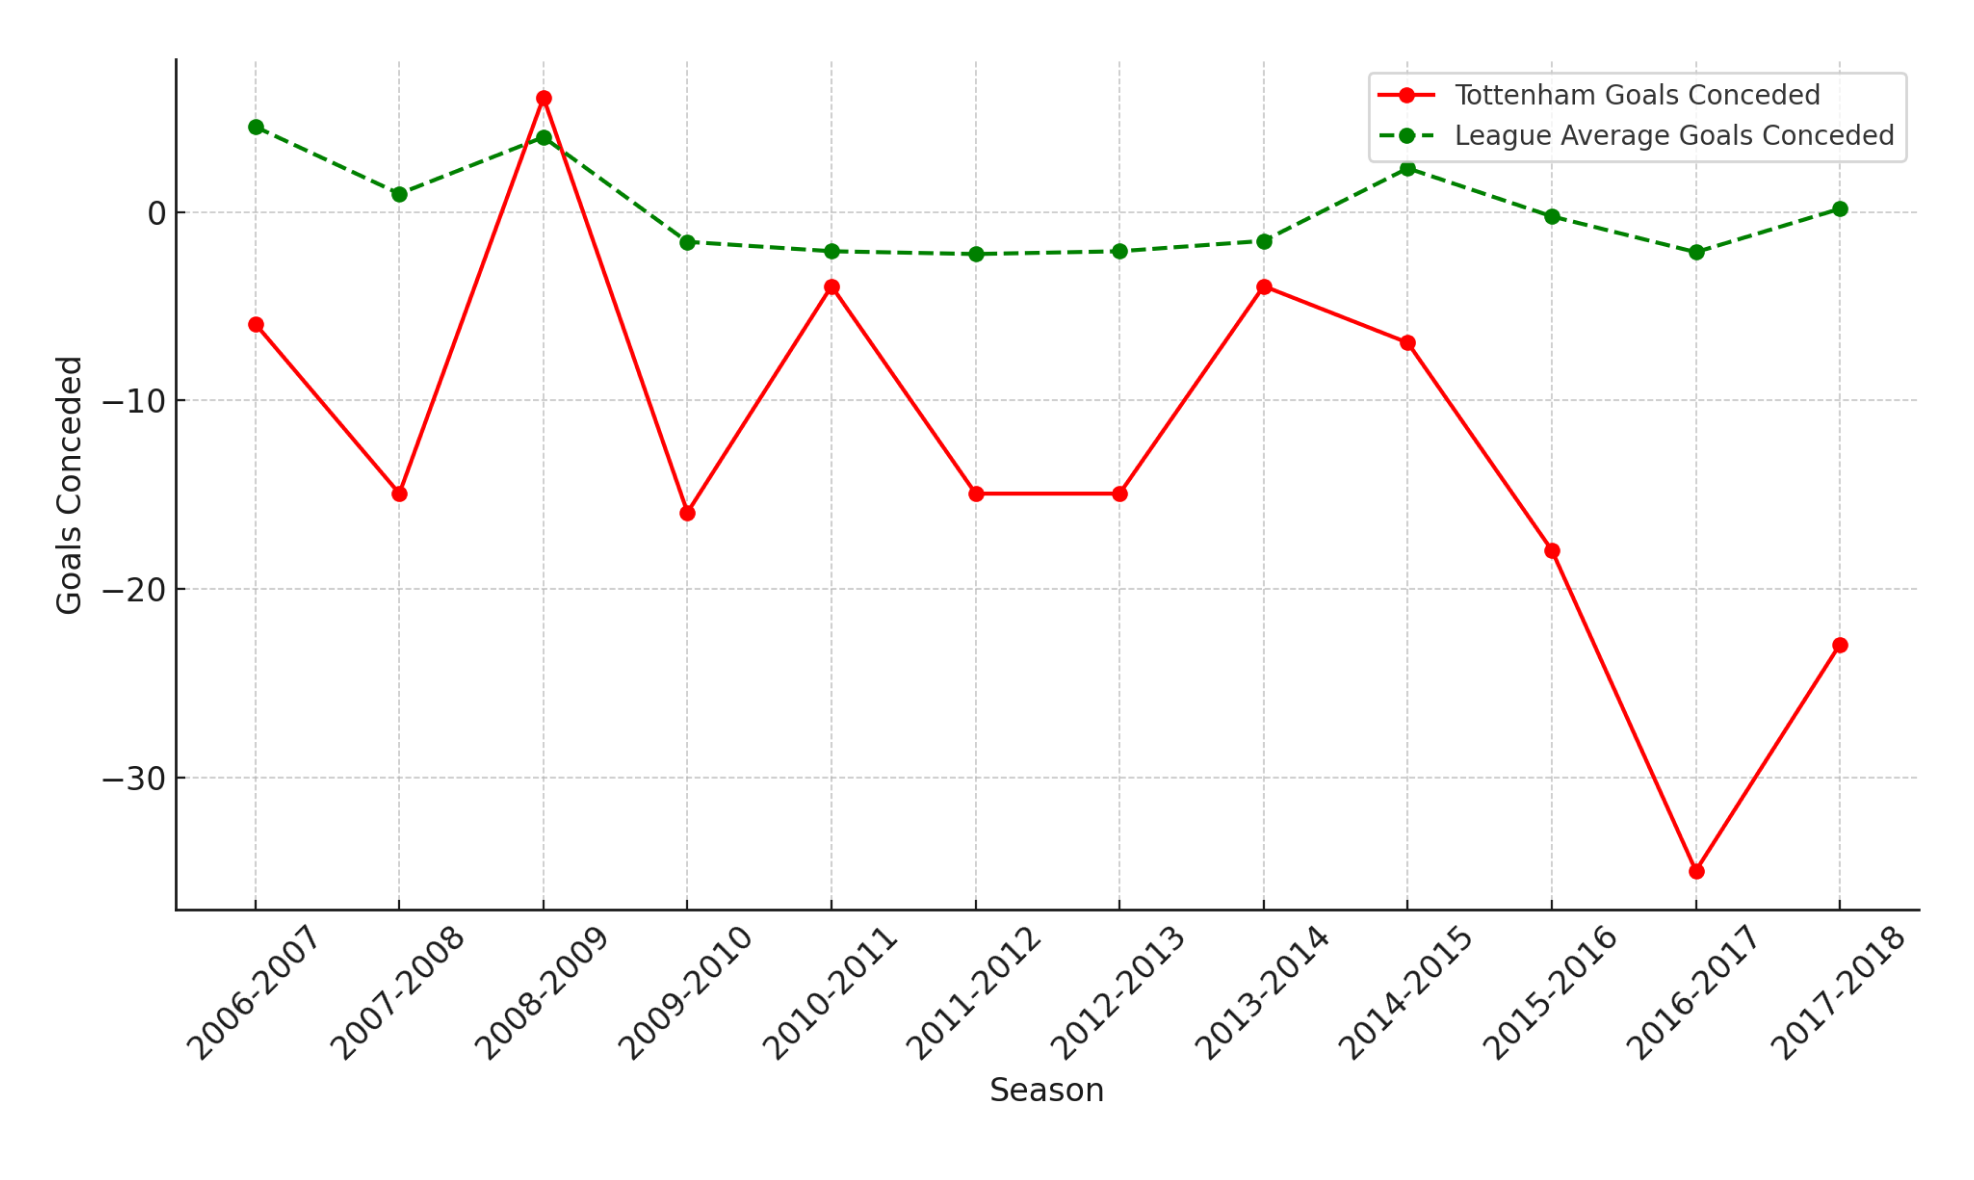
Similarly, goals conceded improved post-2013, highlighting defensive strengthening under certain managerial regimes. These metrics showcase Tottenham's journey toward becoming a top-tier team within the league.
Conclusion
Tottenham Hotspur's journey in the Premier League from 2006/2007 to 2017/2018 reveals a team in transition, striving to cement its position among the elite “Big 6.” Despite their stature, the analysis highlights a key challenge: consistent performance across all aspects of play. The 2016-2017 season stands out as a high point, marked by a balance of offensive and defensive excellence, reflecting the potential of strategic changes and player contributions.
The club's upward trajectory in goals scored and their improved defensive metrics in later seasons indicate progress but also expose inefficiencies, particularly in converting scoring opportunities into tangible outcomes. Disciplinary trends show a notable improvement in maintaining control on the pitch, further emphasizing Tottenham's evolution in competitive and tactical discipline.
When compared to the league average, Tottenham's offensive superiority from 2010 onwards and their defensive strengthening post-2013 underscore their growing competitiveness. However, as noted in the introduction, their lack of major trophies in the past two decades suggests that these improvements have not fully translated into the success expected of a “Big 6” team.
To move forward, Tottenham must address key areas:
- Shooting Efficiency: Focus on improving shot accuracy to capitalize on increased scoring opportunities.
- Strategic Balance: Continue refining the interplay between attack and defense to maintain consistency.
- Trophy Mindset: Build on the lessons from the 2016-2017 season to develop a mentality geared toward winning silverware.
This analysis offers a roadmap for understanding Tottenham's strengths and weaknesses, providing insights that not only explain their historical performance but also guide their journey toward sustained success in the Premier League.